Sketching sine wave
Another (student?) question along trigonometry lines:
Use a graphic calculator or an online version, such as
Function Flyer at Shodor.org.
There are more online graphing resources at my site.
You need to change the 30 degrees to radians first.
So compare 30 to 360; 30/360 is same as 1/12. So take 1/12th part of 2π, which is π/6.
Then enter the function. With the Shodor grapher, you need to use * for multiplication and x for variable, instead of t, and not use degrees but radians.
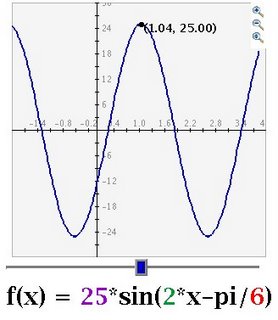
Seeing the sine graph will surely help you sketch yours on paper. Obviously the highest value is 25, the minimum value is -25.
To find its zeros, you need to think:
When does sin y = 0????
It's when y = _______ or y = _______ or when y = ______ (there are tons of these of course since it's cyclical).
Now take the argument 2t-π/6 and let it equal those numbers you found.
2t-π/6 = ___________ or 2t-π/6 = ___________ or ....
Then solve for t.
You should get π/12, 7π/12, 13π/12, 19π/12 etc. as zeros. It has zeros every
6π/12 or every π/2, and its period is π.
To find where it reaches the highest value 25 and lowest value -25, just take the exact midpoint of two consecutive zeroes. (We don't need calculus this time since it's just a simple sine).
Since midpoint of 1/12 and 7/12 is 4/12, this function has a maximum at x = 4π/12, and then a minimum at 10π/12.
P.S. I'm soon going to have a blog contest with giveaways.
Tags: math, mathematics, trigonometry
Sketch the sinusodial waveform given below over one complete cycle showing all essential values. i = 25sin(2t-30degress).
Use a graphic calculator or an online version, such as
Function Flyer at Shodor.org.
There are more online graphing resources at my site.
You need to change the 30 degrees to radians first.
So compare 30 to 360; 30/360 is same as 1/12. So take 1/12th part of 2π, which is π/6.
Then enter the function. With the Shodor grapher, you need to use * for multiplication and x for variable, instead of t, and not use degrees but radians.
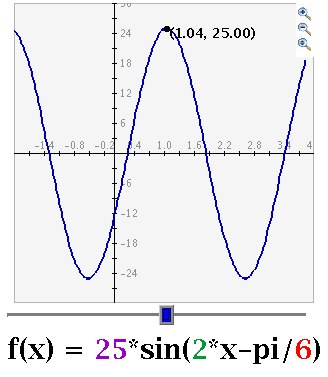
Seeing the sine graph will surely help you sketch yours on paper. Obviously the highest value is 25, the minimum value is -25.
To find its zeros, you need to think:
When does sin y = 0????
It's when y = _______ or y = _______ or when y = ______ (there are tons of these of course since it's cyclical).
Now take the argument 2t-π/6 and let it equal those numbers you found.
2t-π/6 = ___________ or 2t-π/6 = ___________ or ....
Then solve for t.
You should get π/12, 7π/12, 13π/12, 19π/12 etc. as zeros. It has zeros every
6π/12 or every π/2, and its period is π.
To find where it reaches the highest value 25 and lowest value -25, just take the exact midpoint of two consecutive zeroes. (We don't need calculus this time since it's just a simple sine).
Since midpoint of 1/12 and 7/12 is 4/12, this function has a maximum at x = 4π/12, and then a minimum at 10π/12.
P.S. I'm soon going to have a blog contest with giveaways.
Tags: math, mathematics, trigonometry

Comments